Tool #4: Visualising displacement - The Data Dashboard
What is it?
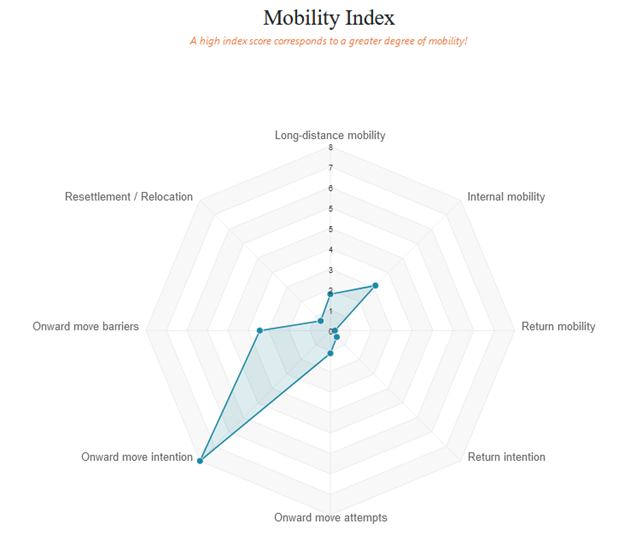
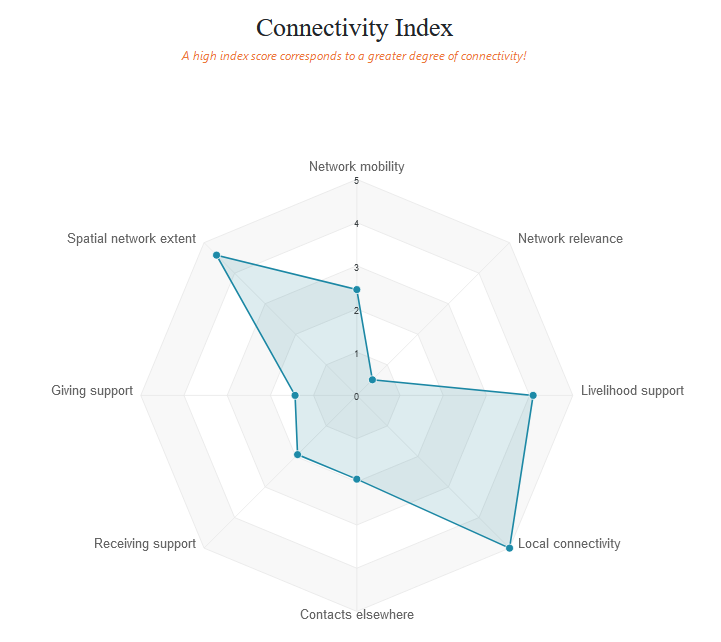
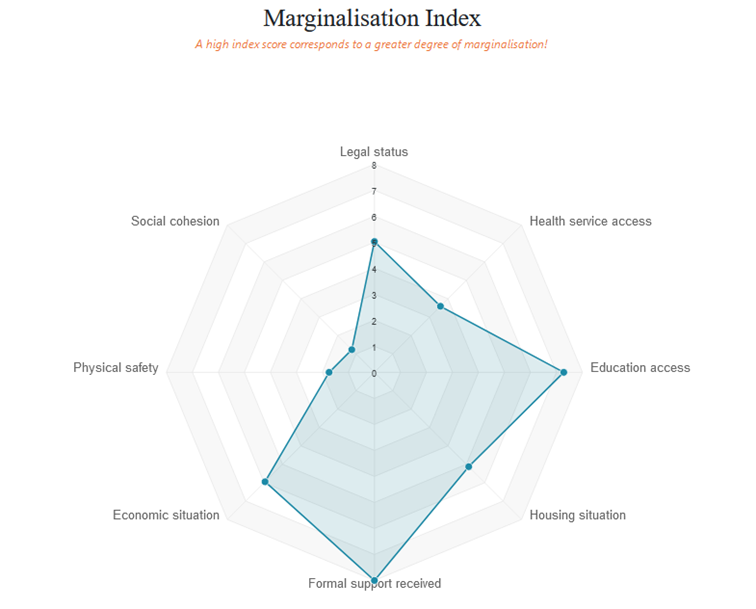
The TRAFIG Data Dashboard is an online database of our survey results from 1897 interviews in six countries. Among other things, the Dashboard uses radar charts to visualise three factors of protracted displacement:
- level of mobility (Mobility Index)
- level of connectivity (Connectivity Index)
- level of marginalisation (Marginalisation Index)
It is based on the assumption that conditions of protracted displacement are marked by refugees and IDPs' low mobility, few connections to others, and a high degree of marginalisation.
Protracted displacement = Mobility (low) + Connectivity (low) + Marginalisation (high).
How do you use the Dashboard?
The Dashboard illustrates protracted displacement of Afghanis, DR Congolese, Eritreans, Pakistanis, and Syrians—the main groups under study in TRAFIG. The Dashboard can be used to compare the displacement experience of all groups, selected groups or a single group.
Let’s take the example of a single group: Eritreans displaced in Ethiopia (for details see TRAFIG working paper no. 5).
The Mobility Index shows that among Eritrean TRAFIG survey respondents (n=395), the vast majority wish to move to another country in the future and are not very mobile within Ethiopia or beyond. In other words, their overall mobility status is low.

Explore the findings on mobility - use the filter 'origin countries' in the data panel.
The Connectivity Index of Eritreans in Ethiopia shows that most survey respondents have good local networks, which also appear to offer livelihood support. It also shows that most respondents have good local, translocal or transnational connections. In other words, the overall connectivity status is high.

Explore the findings on connectivity - use the filter 'origin countries' in the data panel.
The Marginalisation Index shows that most Eritreans in Ethiopia have not received formal support and are, unsurprisingly, in a precarious economic situation. The majority do not appear to have access to education and only minimal access to health services and housing. Their legal status shows that many Eritreans do not have citizenship rights, residence permits or are not registered refugees in Ethiopia, leaving options for livelihood mainly in the informal sector. In other words, their marginalisation status is high.

Explore the findings on marginalisation - use the filter 'origin countries' in the data panel.
What to do with the results?
The combination of these results shows that Eritreans in Ethiopia experience protracted displacement because their mobility status is low and marginalisation is high. While they are well-connected in their local environment, these connections are not sufficient to provide them with the choice to settle down and build a secure future in Ethiopia or to move to another country and try there (for more detailed results see TRAFIG working paper no. 5).
But it also indicates which assets to build upon. Local connections are a strength of Eritrean refugees in Ethiopia and facilitate their own initiatives to make a living. Providing formal support to build on these connections and livelihood activities and formalising Eritreans’ status in Ethiopia is a promising way out of protracted displacement (see TRAFIG practice note no. 5 on how to foster Eritreans’ self-reliance through local integration; see TRAFIG policy brief no. 4 on refugee entrepreneurship in East Africa).
Why use the Dashboard?
The Dashboard can be used to:
| Usage | Description |
|---|---|
| Find targeted solutions for any one of the refugee groups under study | The radar charts illustrate where opportunities exist and where they need to be created. This is relevant for practitioners to programme targeted activities, advocate for change to national/international decision-makers and substantiate proposals for funding. |
| Compare the displacement experience of the refugee groups | The radar charts can be used to show similarities or dissimilarities between different groups. It helps to prevent over-generalising the experience of all refugees. |
| Identify the strengths and needs of different refugee groups | The Dashboard shows the strengths that different refugee groups possess, as well as their needs. Anyone interested in moving beyond place-based, individual solutions can use the Dashboard for insights on how group network and connectivity can be bolstered through formal support. |
The Dashboard can also be used to understand protracted displacement by specific demographic characteristics. For example, radar charts illustrate the mobility, connectivity and marginalisation of survey respondents by:
- Countries of study (see example of Eritrean interviewed in Ethiopia)
- Origin country
- Gender
- Age
- Marital status
- Education
- Protection status
- Site type where survey took place (urban, peri-urban, rural)
- In/Outside of refugee camp
Contact the TRAFIG team, if you have comments or questions on the data dashboard: contact@trafig.eu